
Pilots check the weather before they roll onto the runway. The plane hasn’t changed. The air has. The listing climate works the same way in NYC real estate. Your apartment is the same apartment it was six months ago. The conditions it has to sell into are not.
Most pricing mistakes don’t come from bad comps. They come from ignoring the current climate. The same apartment priced correctly in December can be overpriced in March. And the same apartment priced correctly in March can sit by June if the window closes. That’s where most deals go sideways.
The UrbanDigs Climate Index puts a number on those conditions. It measures how hard it is to get from listed to in contract, right now, in a specific sector. In Manhattan, anything at or above 2.48 is an Easy climate and sellers have leverage. Anything at or below 1.20 is a Challenging climate and buyers have leverage. Everything in between is neutral, which is the most unforgiving place of all, because neither side has the upper hand.
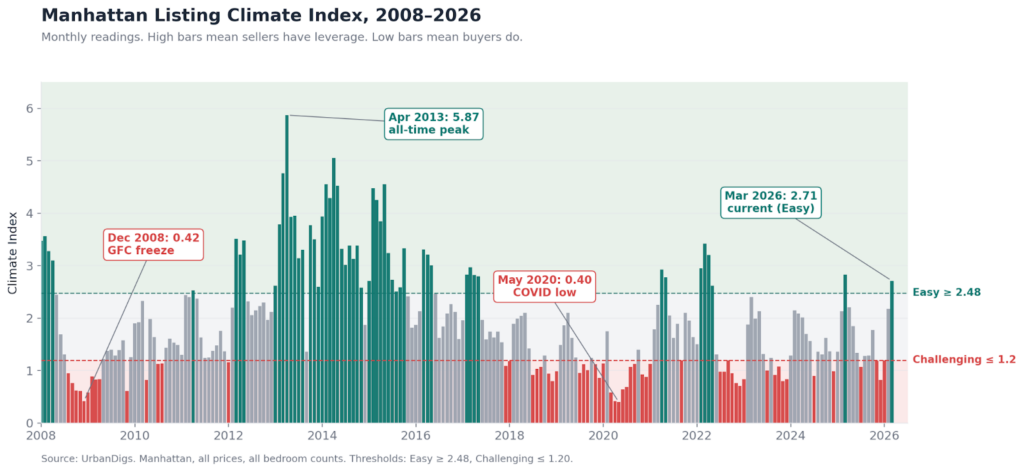
Two things stand out on the long-run Manhattan chart. First, the range is enormous: 0.40 at the May 2020 COVID low, 0.42 in the Dec 2008 GFC freeze, 5.87 at the April 2013 peak. Second, the market spends most of its time in the middle. About half of the last eighteen years sits in the neutral band. Easy markets and challenging markets are the exceptions, not the rule.
High bars mean easy air
Listings are being absorbed faster than new ones are arriving. Deals clear in weeks. Discounts compress. Repricing is a last resort, not an opening move. Agents stop being apologetic in the showing. The 2013–2015 stretch is the textbook case: Climate ran above 4 for months, and sellers who priced aggressively were effectively running auctions.
Low bars mean thin air
New listings arrive faster than they are absorbed. The buyer pool is smaller, slower, and more selective. Discounts widen. Days on market stretch. The first price cut isn’t enough. You don’t need a pandemic to produce a low-bar market, either. Every winter the Index dips for reasons that have nothing to do with the macro and everything to do with the calendar.
Brooklyn has its own weather
Brooklyn has a shorter runway in the data, starting in March 2020, but the same structure applies with its own calibration: Easy at 2.36, Challenging at 1.49. The post-COVID recovery drove Brooklyn to a 4.08 series peak in March 2022, and the 2023–2024 softening looks different on this chart than it does on Manhattan’s.
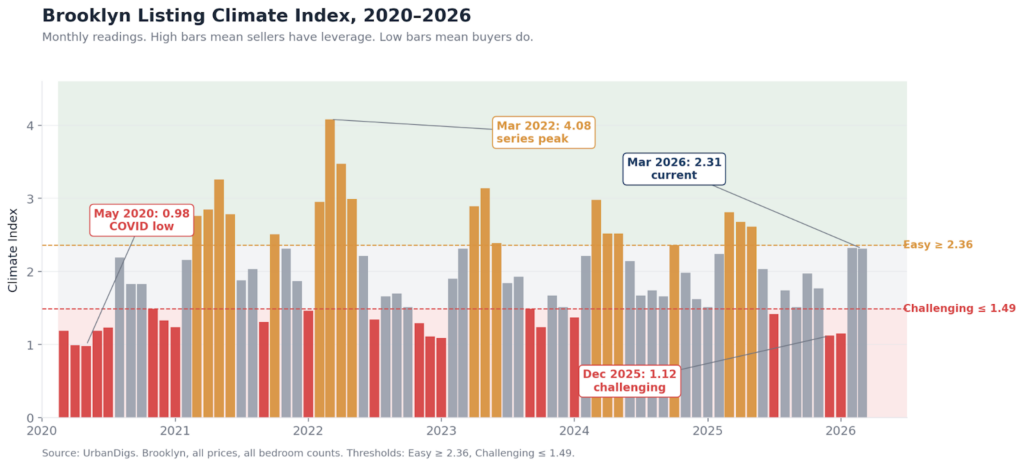
Brooklyn’s Challenging line sits higher than Manhattan’s because Brooklyn historically absorbs supply faster. A 1.49 reading in Brooklyn means real pressure on sellers. The same 1.49 in Manhattan would be a perfectly ordinary neutral month. Climate is not a single cross-borough scale. Each sector gets its own thresholds, calibrated to its own market.
What happened this winter, and what just happened this spring
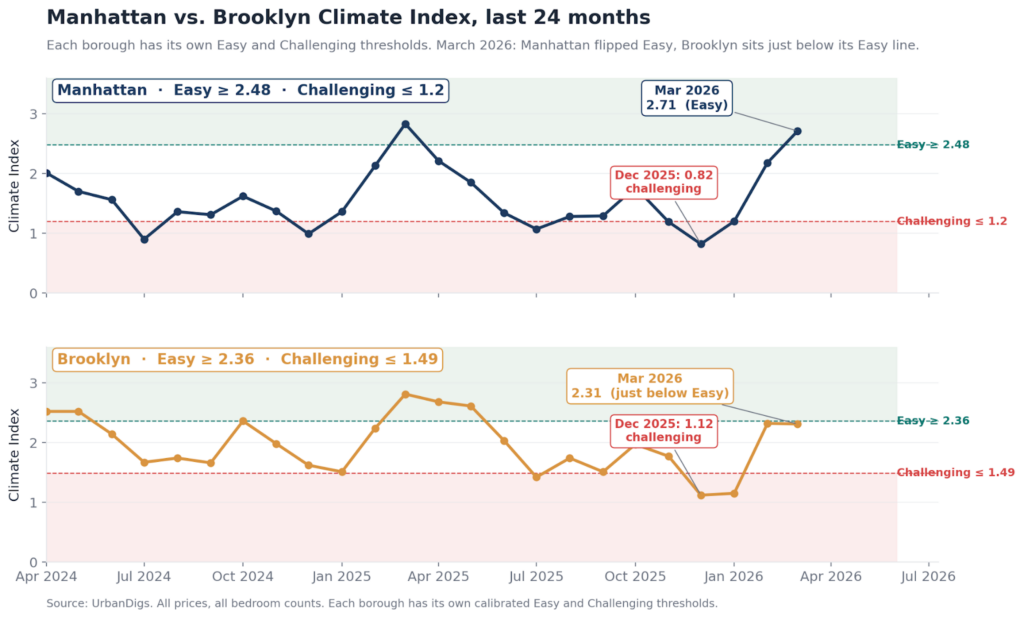
Manhattan printed 0.82 in December, solidly below its Challenging line. Three months later it printed 2.71, solidly above its Easy line. That’s a fast turn.
Brooklyn moved the same direction on its own scale: 1.12 in December, Challenging by its own standard, and 2.31 in March, right under its Easy line. Two different boroughs, one directional story this spring.
Translating climate into decisions
Selling? The biggest mistake agents make is pricing as if conditions will hold. They don’t. Right now Manhattan is in an Easy climate — but that window is seasonal, not permanent.
If your pricing assumes today’s leverage will still be there in 60-90 days, you’re exposed.
This is where most listings lose momentum.
Buying? The leverage you had in December is gone.
That wasn’t theoretical – it was real negotiating power.
If you’re still operating with a winter mindset, you’re already behind the market.
One more thing: these are borough-wide readings.
The Climate Index can be sliced by price range, property type, neighborhood, sub-neighborhood, and bedroom count.
That hyper-local climate is what actually determines whether your listing moves – or sits.
This is exactly where most pricing decisions break down.
If you’re walking into a listing, preparing for a price adjustment, or trying to understand why a deal isn’t moving, this is the layer that matters most.
👉 Request a sample Advisor report to see how this is applied to a specific property.
We’ve seen this play out repeatedly.
Listings that come to market priced for a stronger climate often sit through the shift, forcing multiple price cuts just to catch up to where the market actually is.
By the time the price aligns, momentum is already gone.